CDT debugger establishes a connection with Creo.JS instance in the V8 inspector protocol through a Web socket within the internal Creo.JS Web server. To make a debugger connection, the internal Creo.JS Web server must be started. To start the internal Web server, perform the following steps:
|
1. |
Manually configure Creo to specify the desired Web server port by editing the creo_js_app.conf file located in your working directory. |
|
2. |
You can use a special Web page start_creojs_debugger.html to check the status of the Creo.JS Web server.
Note
The start_creojs_debugger.html file is used to invoke the special Web page and is included in the Creo installation at <creojs_loadpoint>\creojs\creojsweb location.
|
|
3. |
To start the Web server, open the start_creojs_debugger.html file in the embedded browser by specifying the full path of the file. After the page opens, you get a link for connecting
to the Creo.JS via Chrome remote debugger. For example, if the Creo.JS Web server starts on port 8080, you will get the following message:Creo.JS debugger
Creo.JS web server is started on port 8080.
To debug your CreoJS code please do the following:
1. Open Chrome browser
2. Open the link in a browser window
devtools://devtools/bundled/inspector.html?v8only=true&ws=127.0.0.1:8080/debug
3. In the Creo embedded browser open a page you want to debug
4. In the Console bottom panel select a context
(usually title of the page to debug) you plan on debugging You can also start the Web server using the startWebServer{port_number} function which can be invoked using the script_engine_testing.html web tool.
Note
If you want to start the Creo.JS Web server manually, the port number in the above link should be replaced with the configured port number from the creo_js_app.conf file located in your working directory.
|
|
4. |
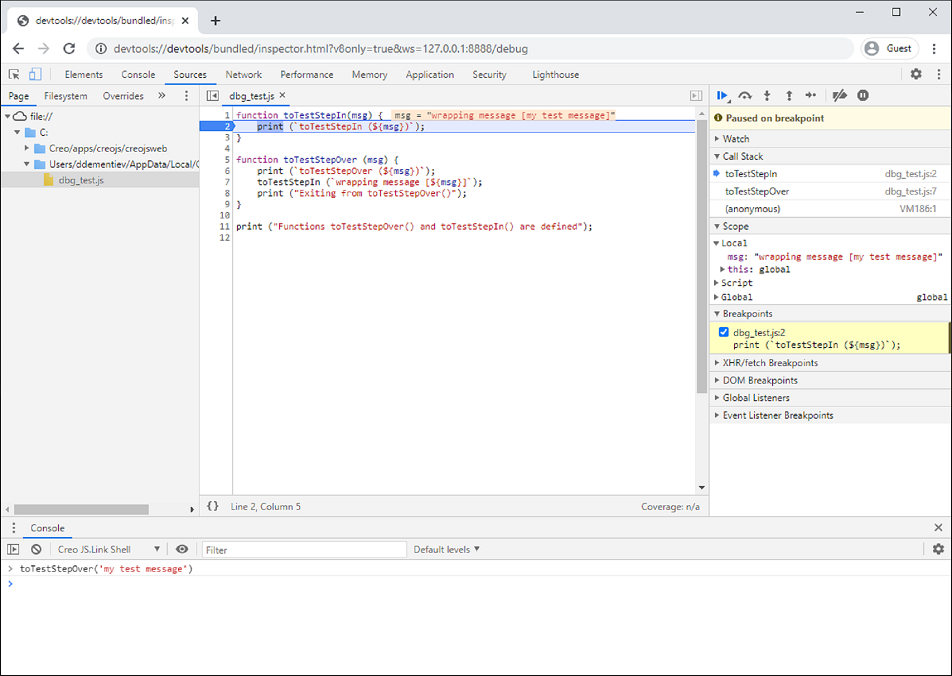
After the remote debugger opens, you can perform various operations using the toolset provided in the debugger, such as browsing
the source of Creo.JS scripts, setting break points in debugging scripts, viewing local variables of the current context, evaluating expressions
within the current context, and switching between different Creo.JS contexts. For more details about the various operations that can be performed in the debugger, refer to the start_creojs_debugger.html page. |
|
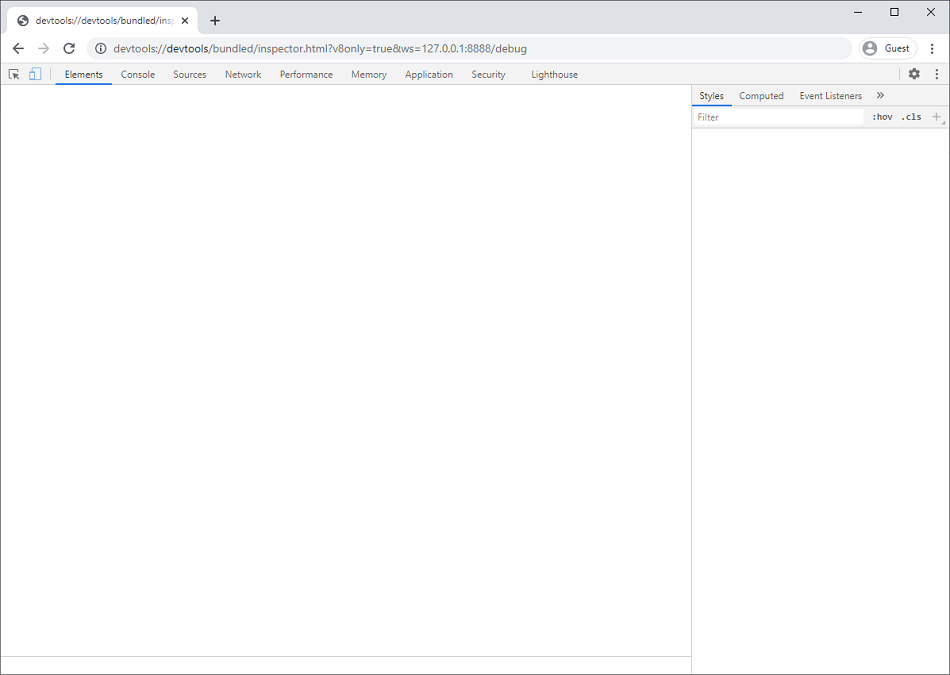
5. |
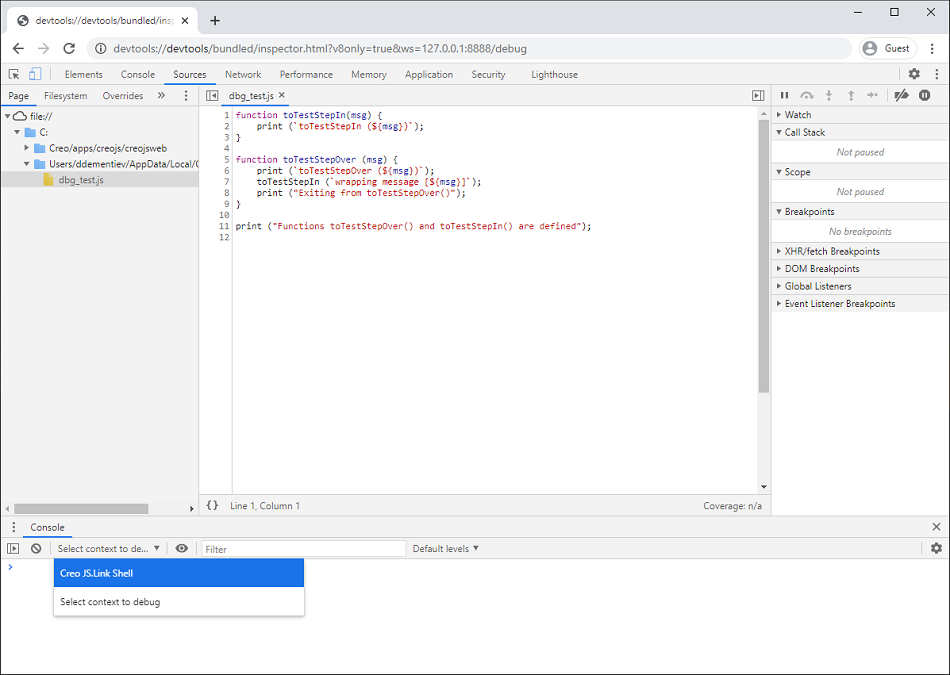
If you are using Chrome DevTools for the first time, you will see a window similar to the following image:
|
|
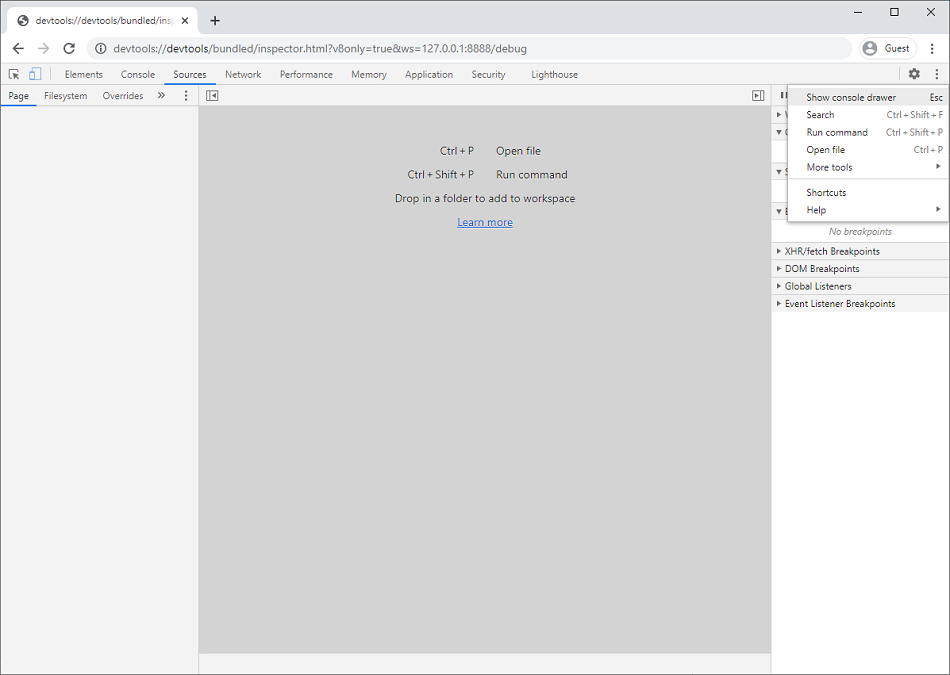
6. |
You can switch to the Sources tab if you want to access the Creo.JS scripts and perform other operations such as call stack view, local and global variables, and break points.
|
|
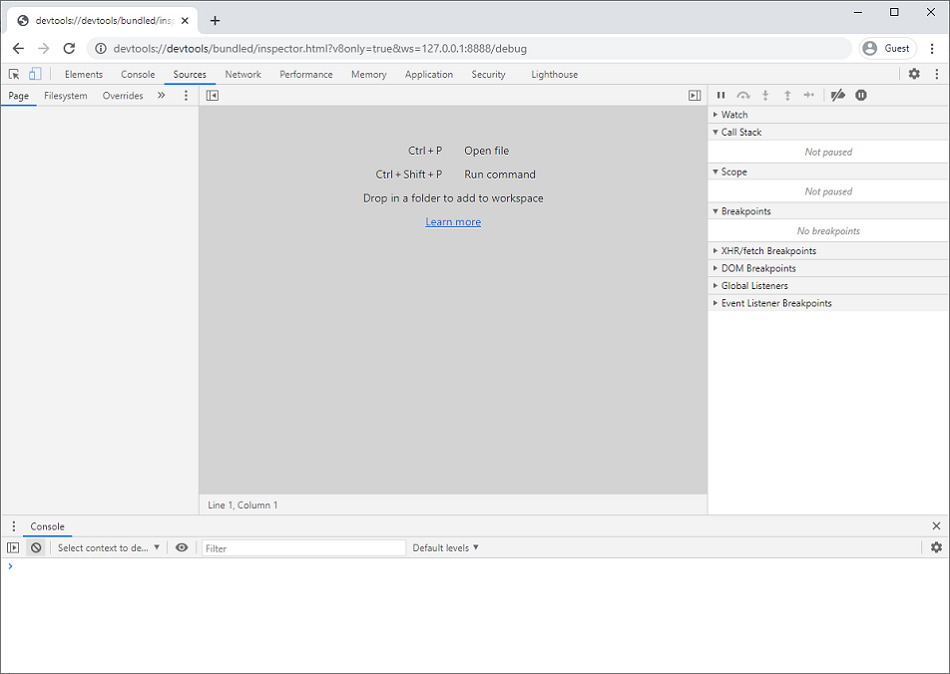
7. |
Although you can see a separate Console tab, it is recommended that you use the Console tab next to the Sources tab.
|
|
8. |
In the Console tab, you can see the context that you have currently selected and the text area where the console commands can be executed.
You can see the behavior of the functions present in the present context.
|